Core Concepts
Palito is a library designed to automate the visualization and management of IT infrastructure topology.
It streamlines the traditionally manual process of creating network diagrams and enables efficient IT asset management.
Background
Listing IT assets in tables alone makes it difficult to grasp the entire system architecture.
Common issues include:
- IT asset lists managed with complex Excel files
- Network diagrams drawn manually
- Difficulty reflecting real-time updates
Palito automates these repetitive, inefficient tasks, providing visual outputs that are easy to understand at a glance.
Workflow Comparison
Here’s a before-and-after comparison of workflow with and without Palito.
Experience topology generation with a single click.
Traditional Workflow
Foxee Graph Workflow
As shown above, Palito automates most of the previously manual processes, significantly reducing the time required.
Palito also automates the maintenance and updates of topologies. Below is a comparison of manual vs automated updates.
Compare maintenance tasks
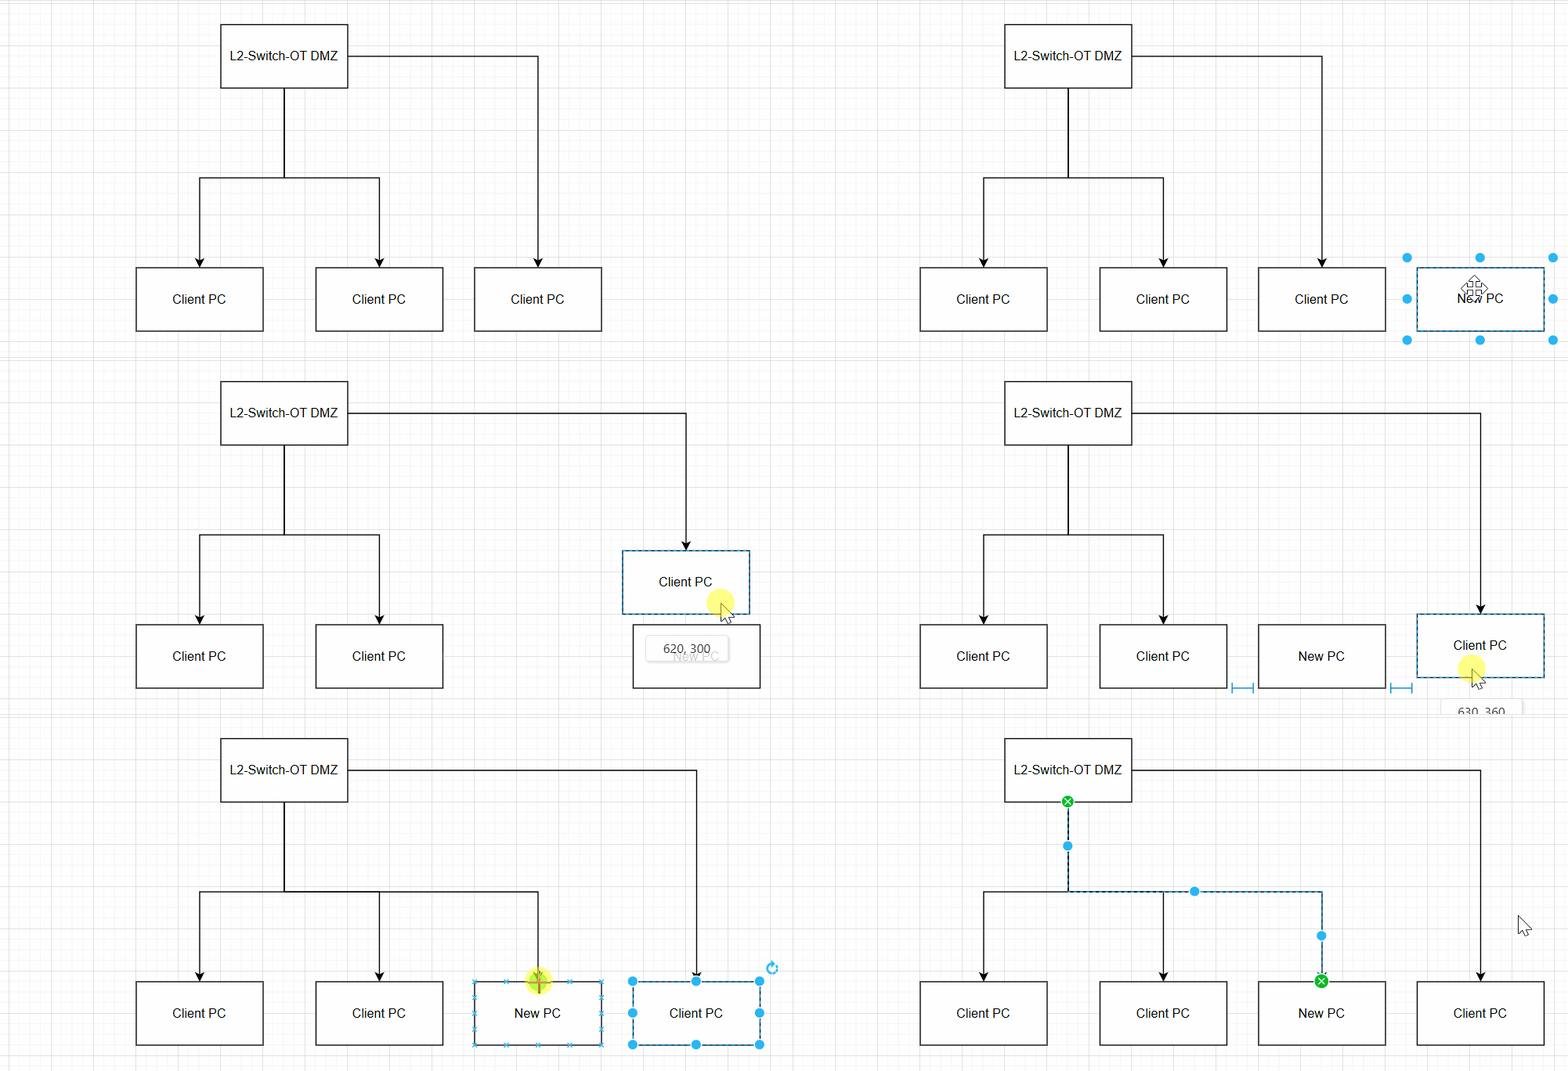
Update manually
It's inefficient..
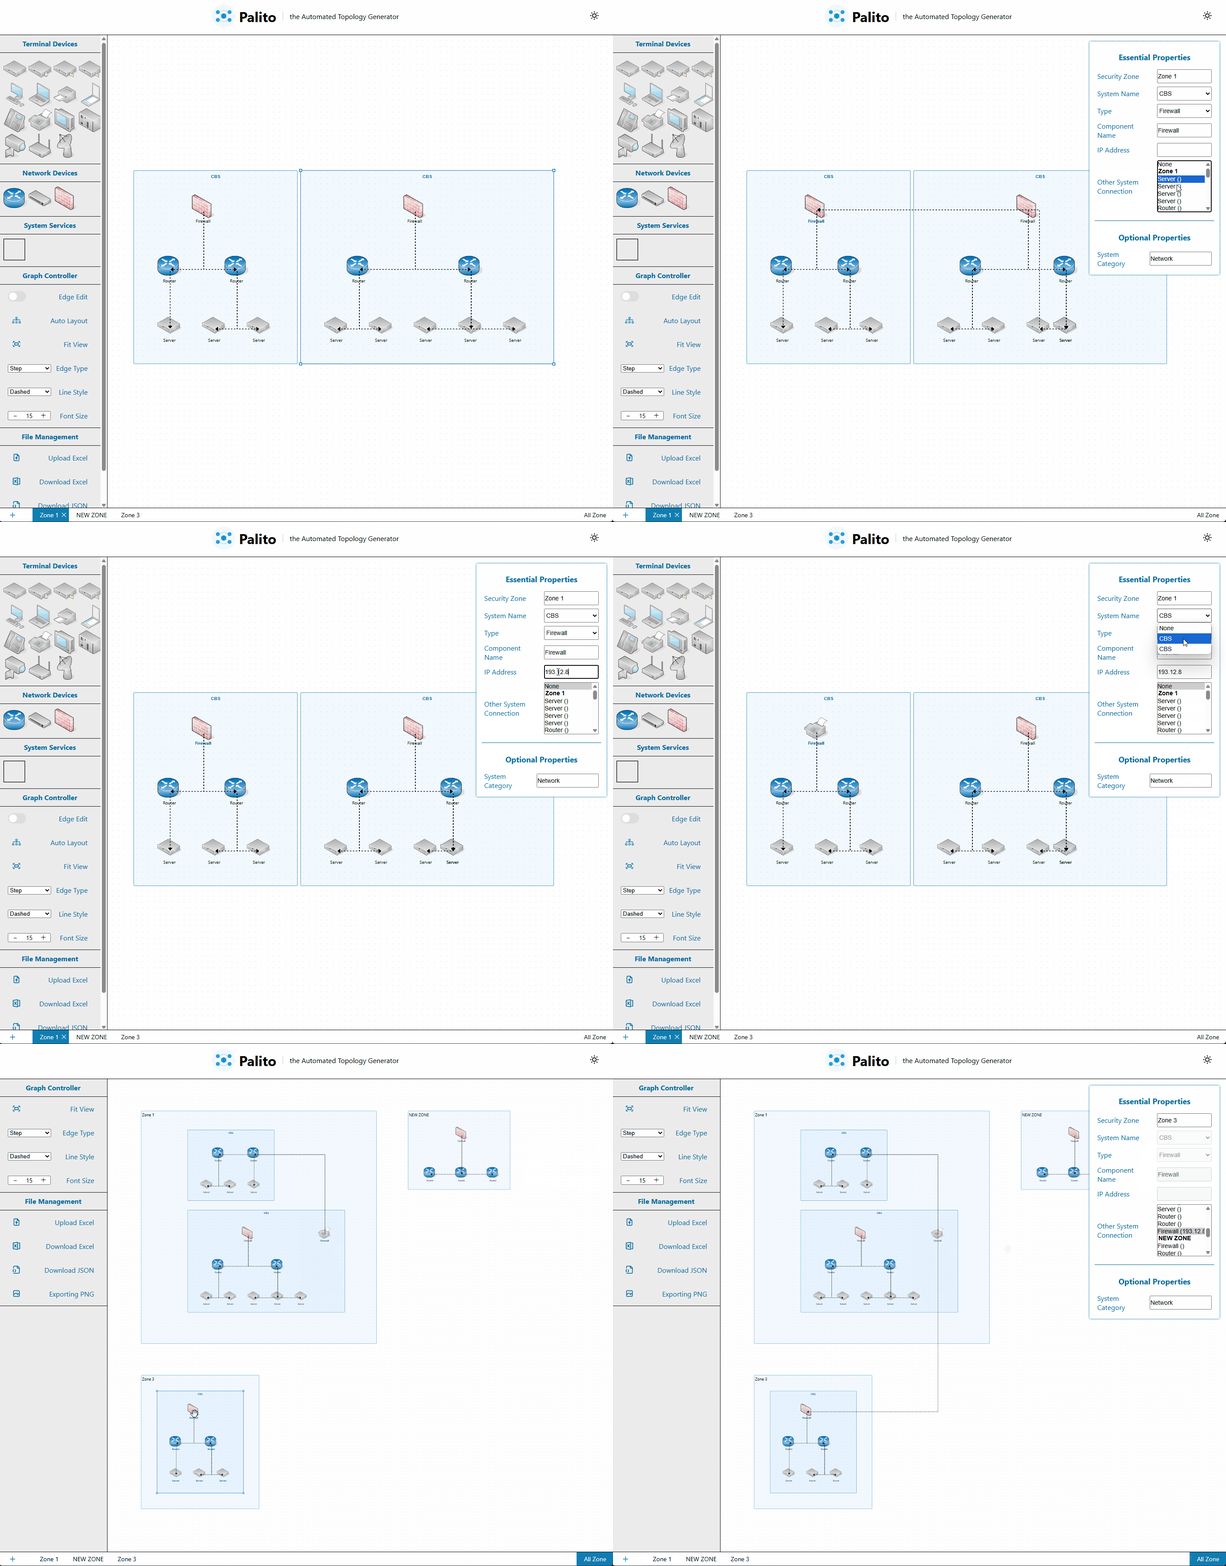
Update automatically
It's efficient!!
Core Workflow
This section outlines the key steps in Palito’s workflow.
1. Data Import
The first step is converting Excel-based asset lists into node data.
IT assets are transformed into nodes that are easier to manage.
You can continue using your existing Excel-based asset management workflow.
2. Node Generation
Converted nodes are grouped into the following hierarchy:
- Zone: Top-level logical grouping
- Separated by department, project, or location
- Independent units for management
- CBS (Clustered Bus System)
- Subgroup within a Zone based on network structure
- Automatically groups related nodes
- Node
- Individual IT assets such as devices, servers, or network equipment
3. Relationship Analysis
The core of topology is expressing relationships between assets. Palito provides:
- Automatic network relationship detection between nodes
- Auto-generation of edges
Click nodes in the diagram below!
관계 분석 프로세스
CBS: CBS 1
CBS: CBS 1
CBS: CBS 2
CBS: CBS 3
4. Node Layout
To clearly visualize complex networks, Palito supports:
- Automatic placement of nodes within Zones
- Minimizing overlap
- Auto-scaling of Zones and CBS
- Layout algorithms to clarify node relationships
Auto Layout Demo
After Topology Generation
This section explains what you can do once your topology is built with Palito.
1. Intuitive Interaction
Built with ReactFlow, Palito supports rich user interactions:
- Freely move nodes with mouse
- Right-click to open node handler list
- Add new nodes with drag-and-drop
- Click nodes to edit asset details
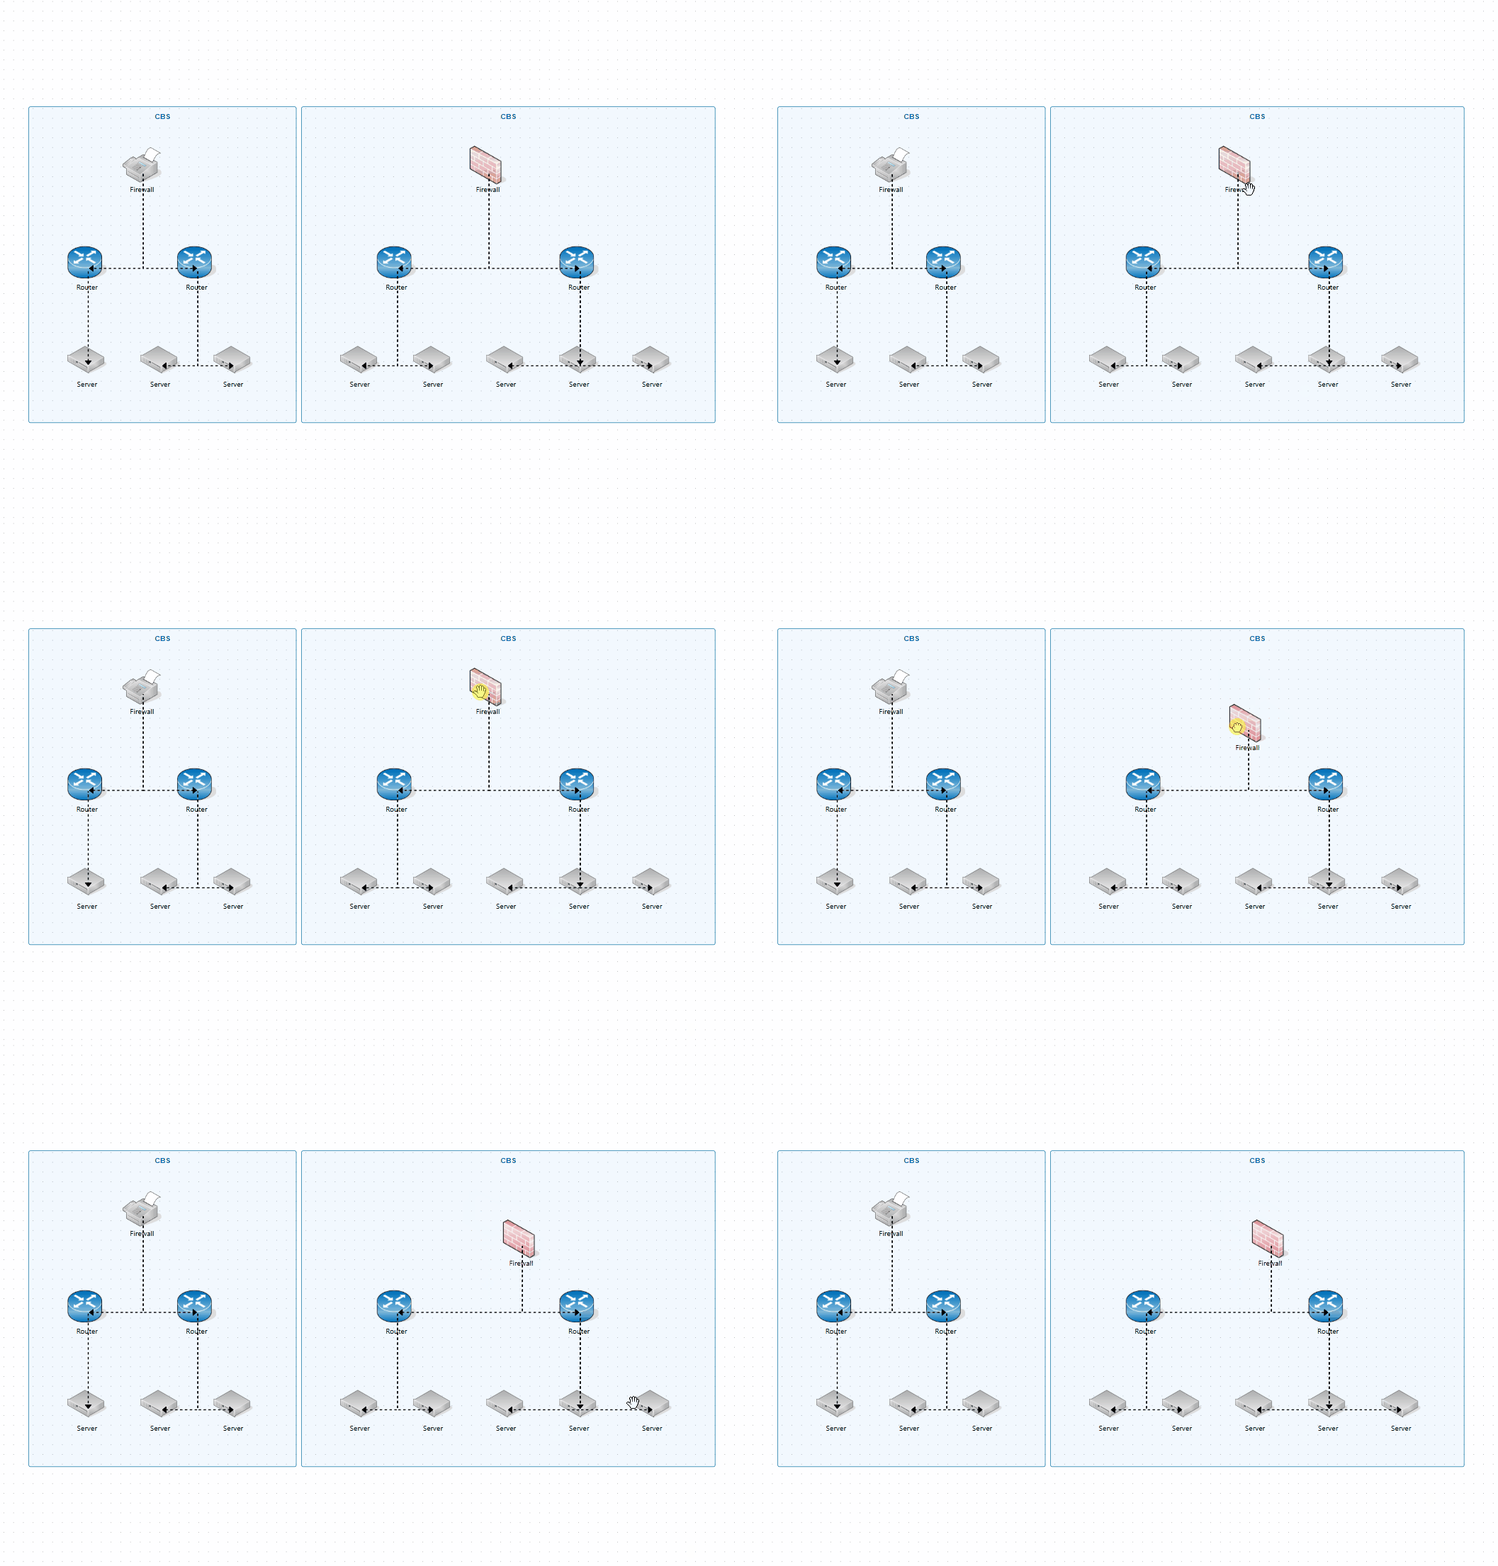
Move nodes with mouse
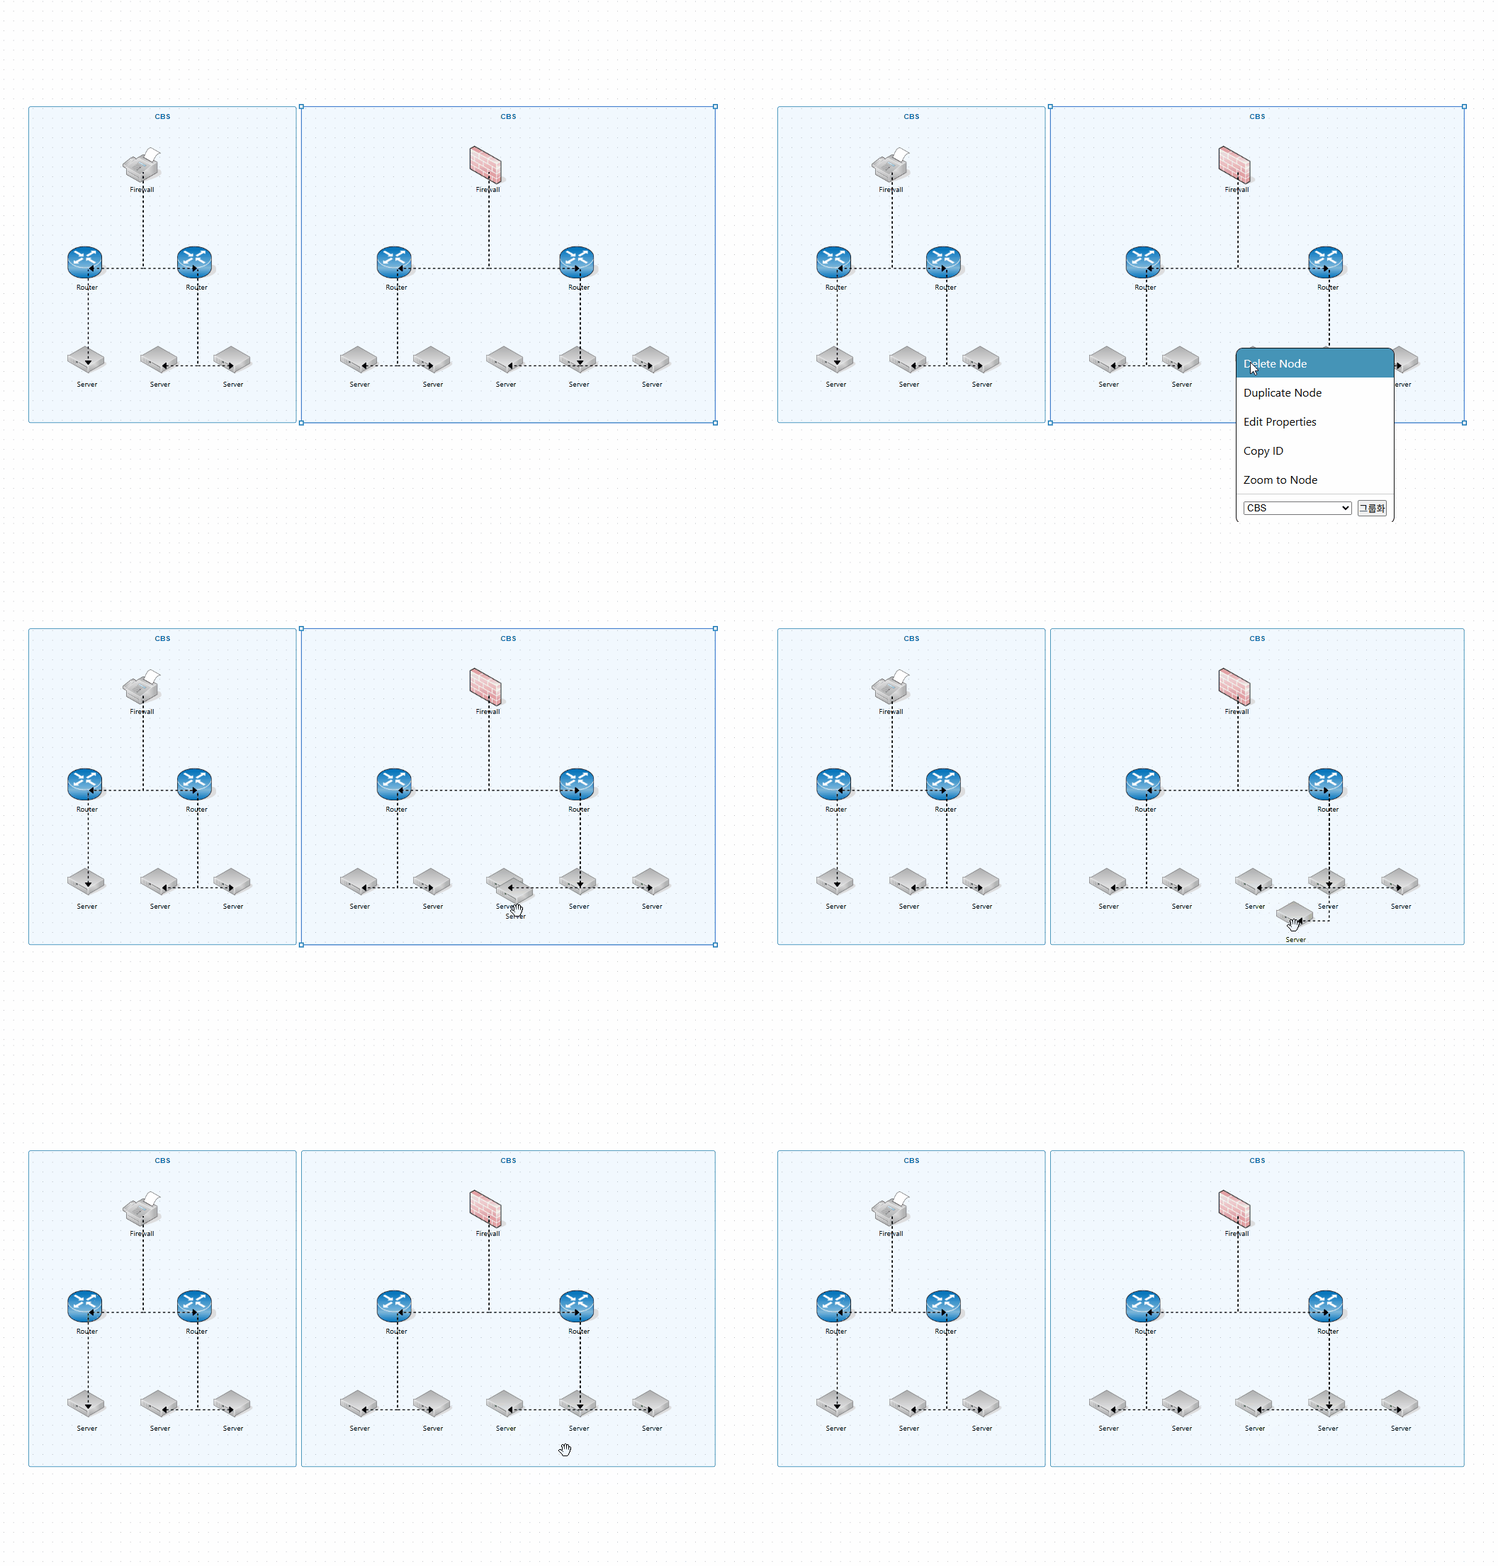
Right-click handler
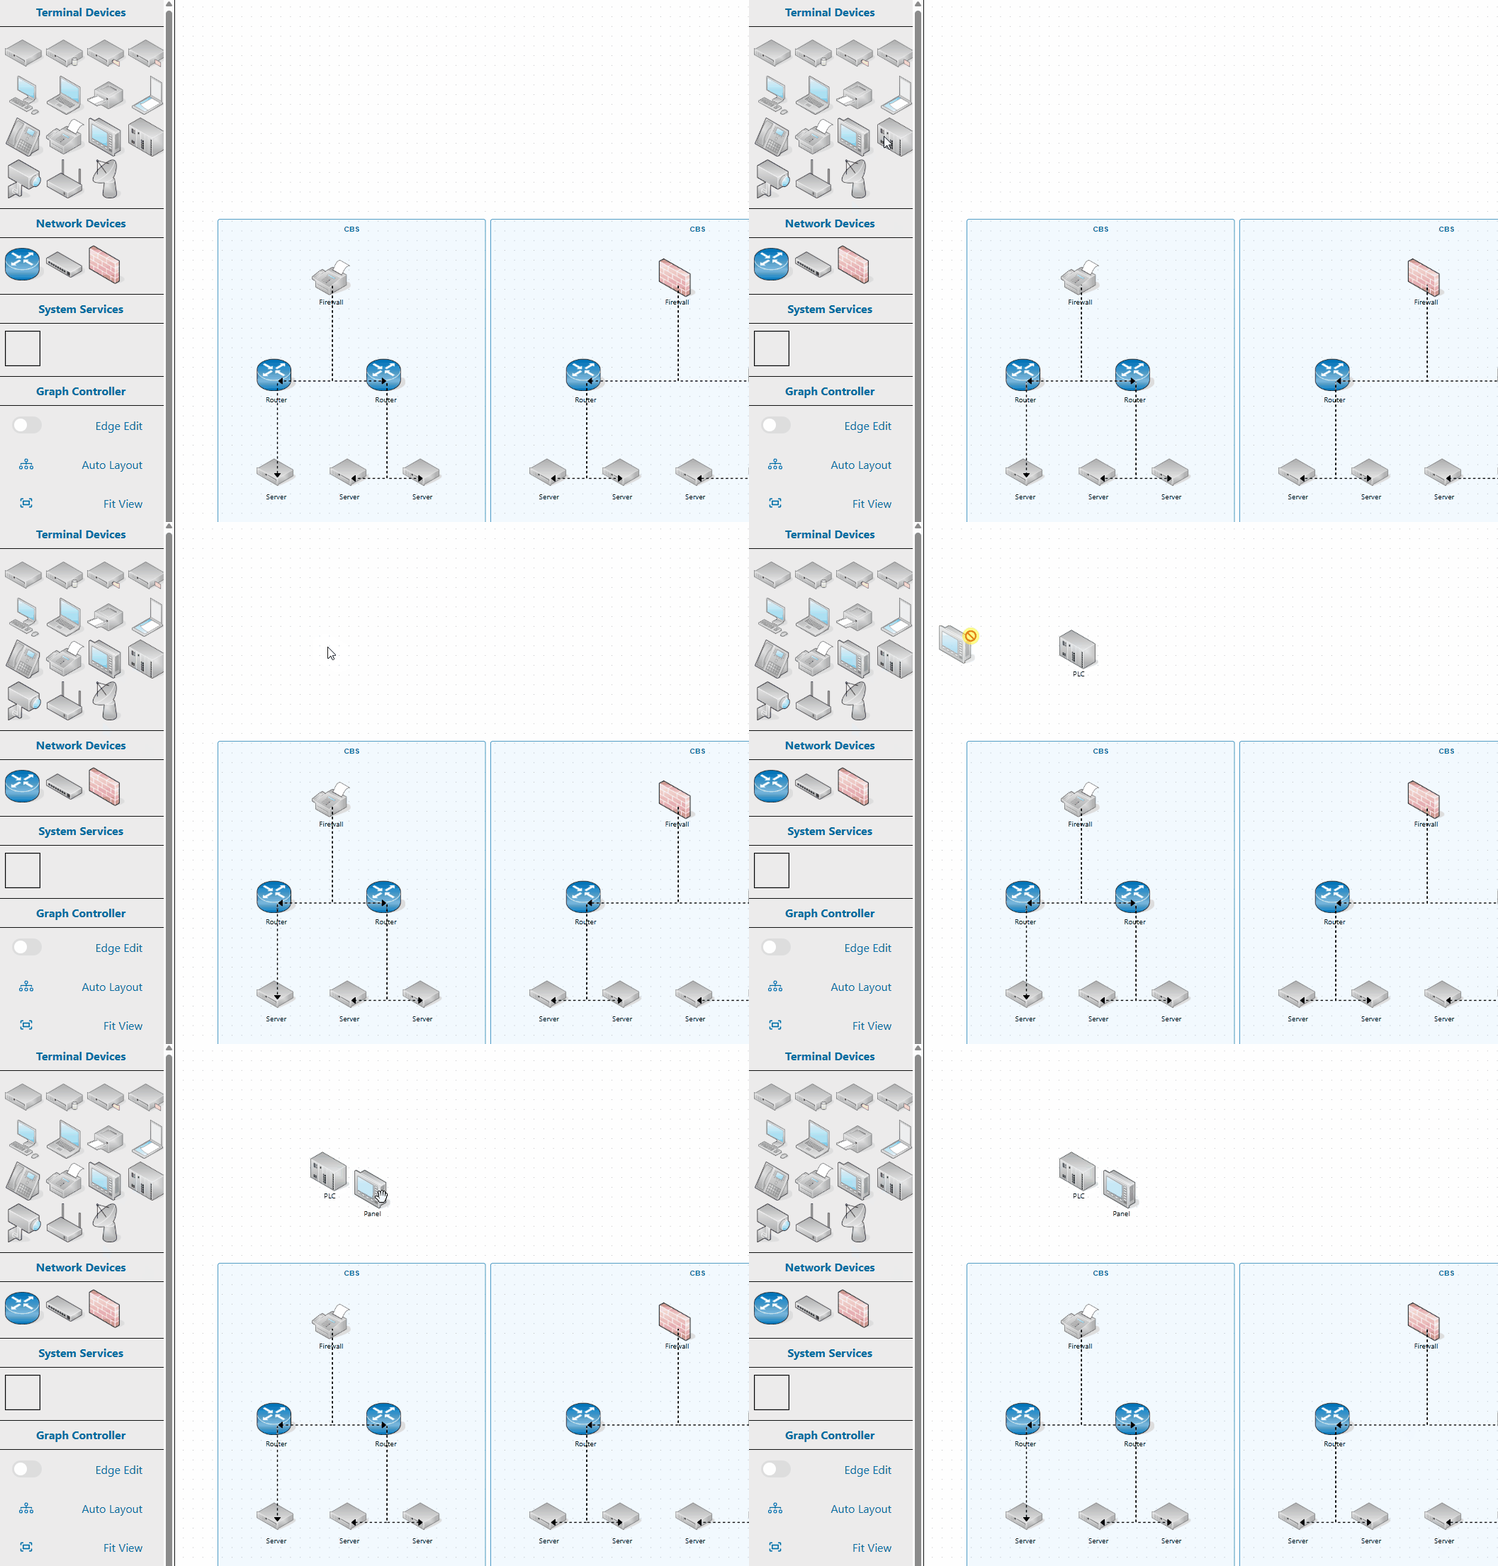
Add nodes with mouse
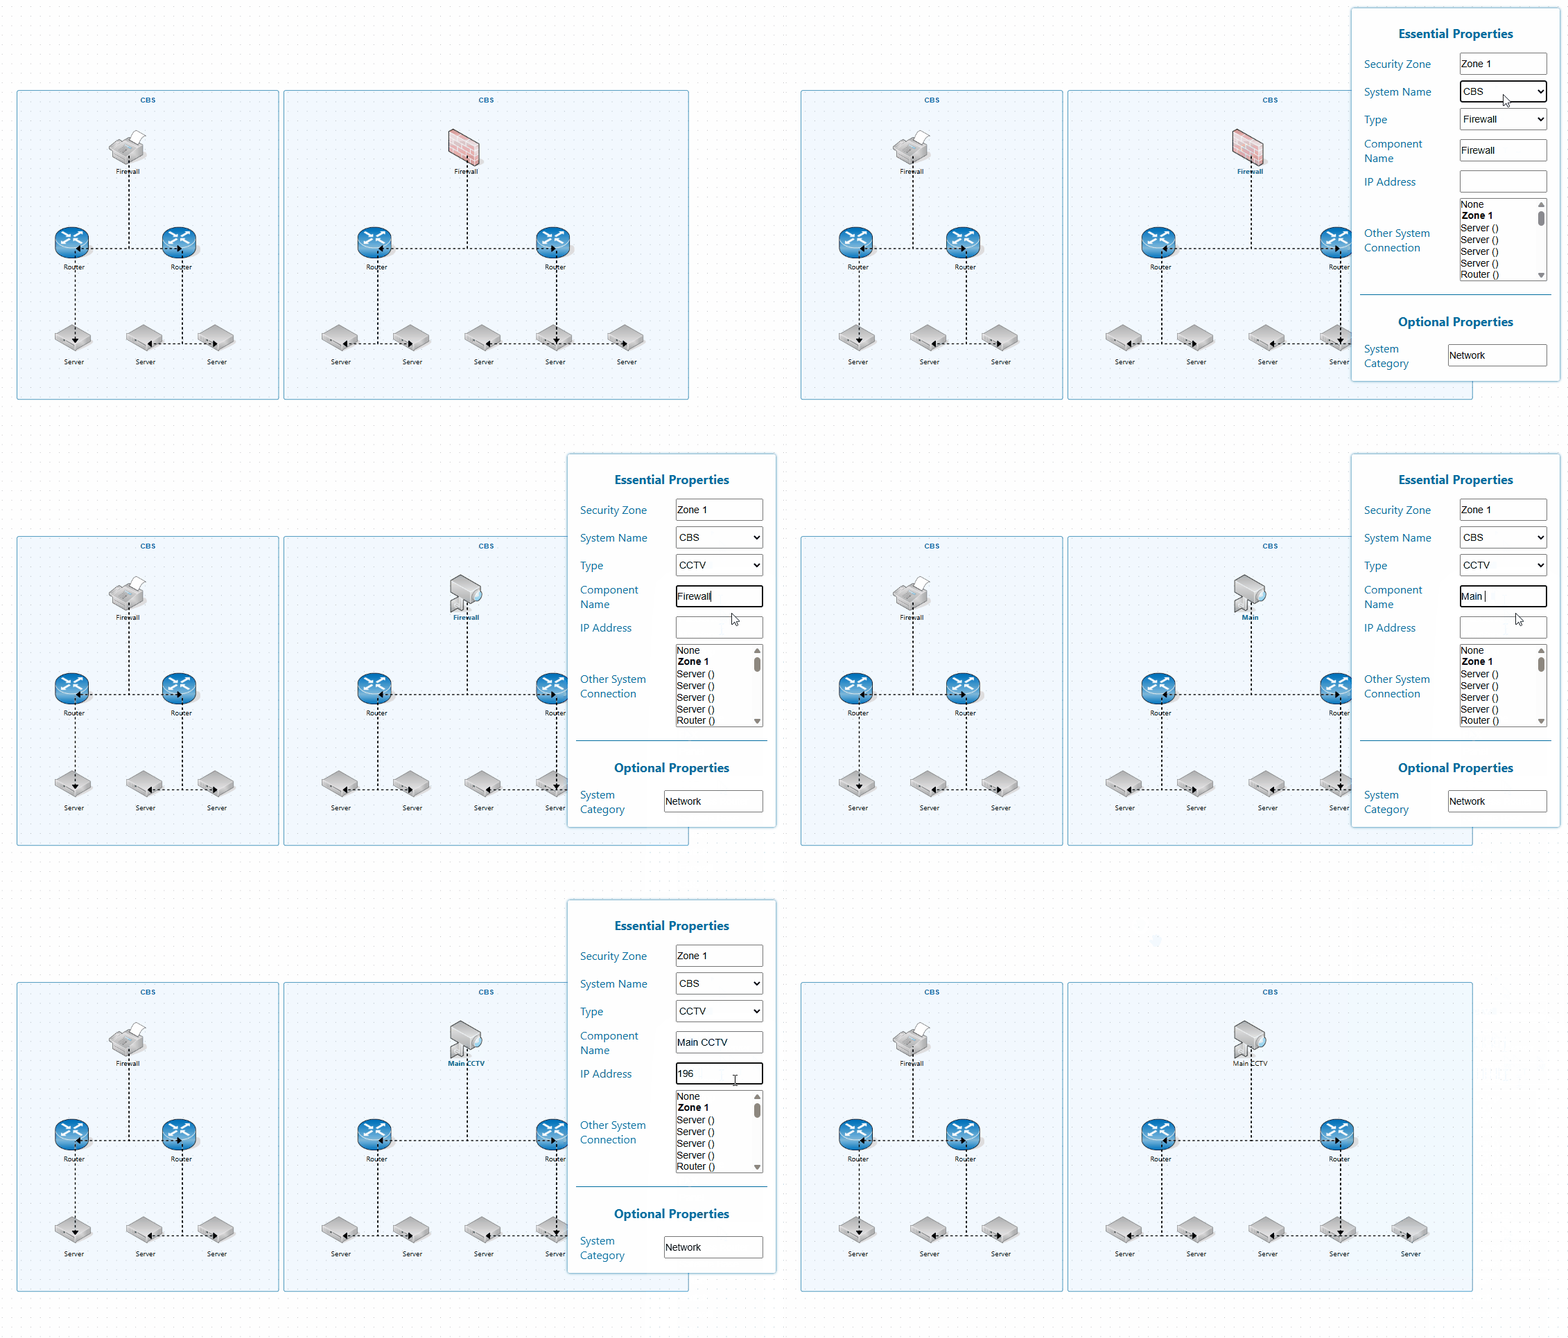
Update node information by clicking
2. Flexible View Modes
Palito supports multiple view modes for different use cases:
- All Zones View: See the entire system at once
- Zone View: Focus on detailed structure of a specific Zone
All View
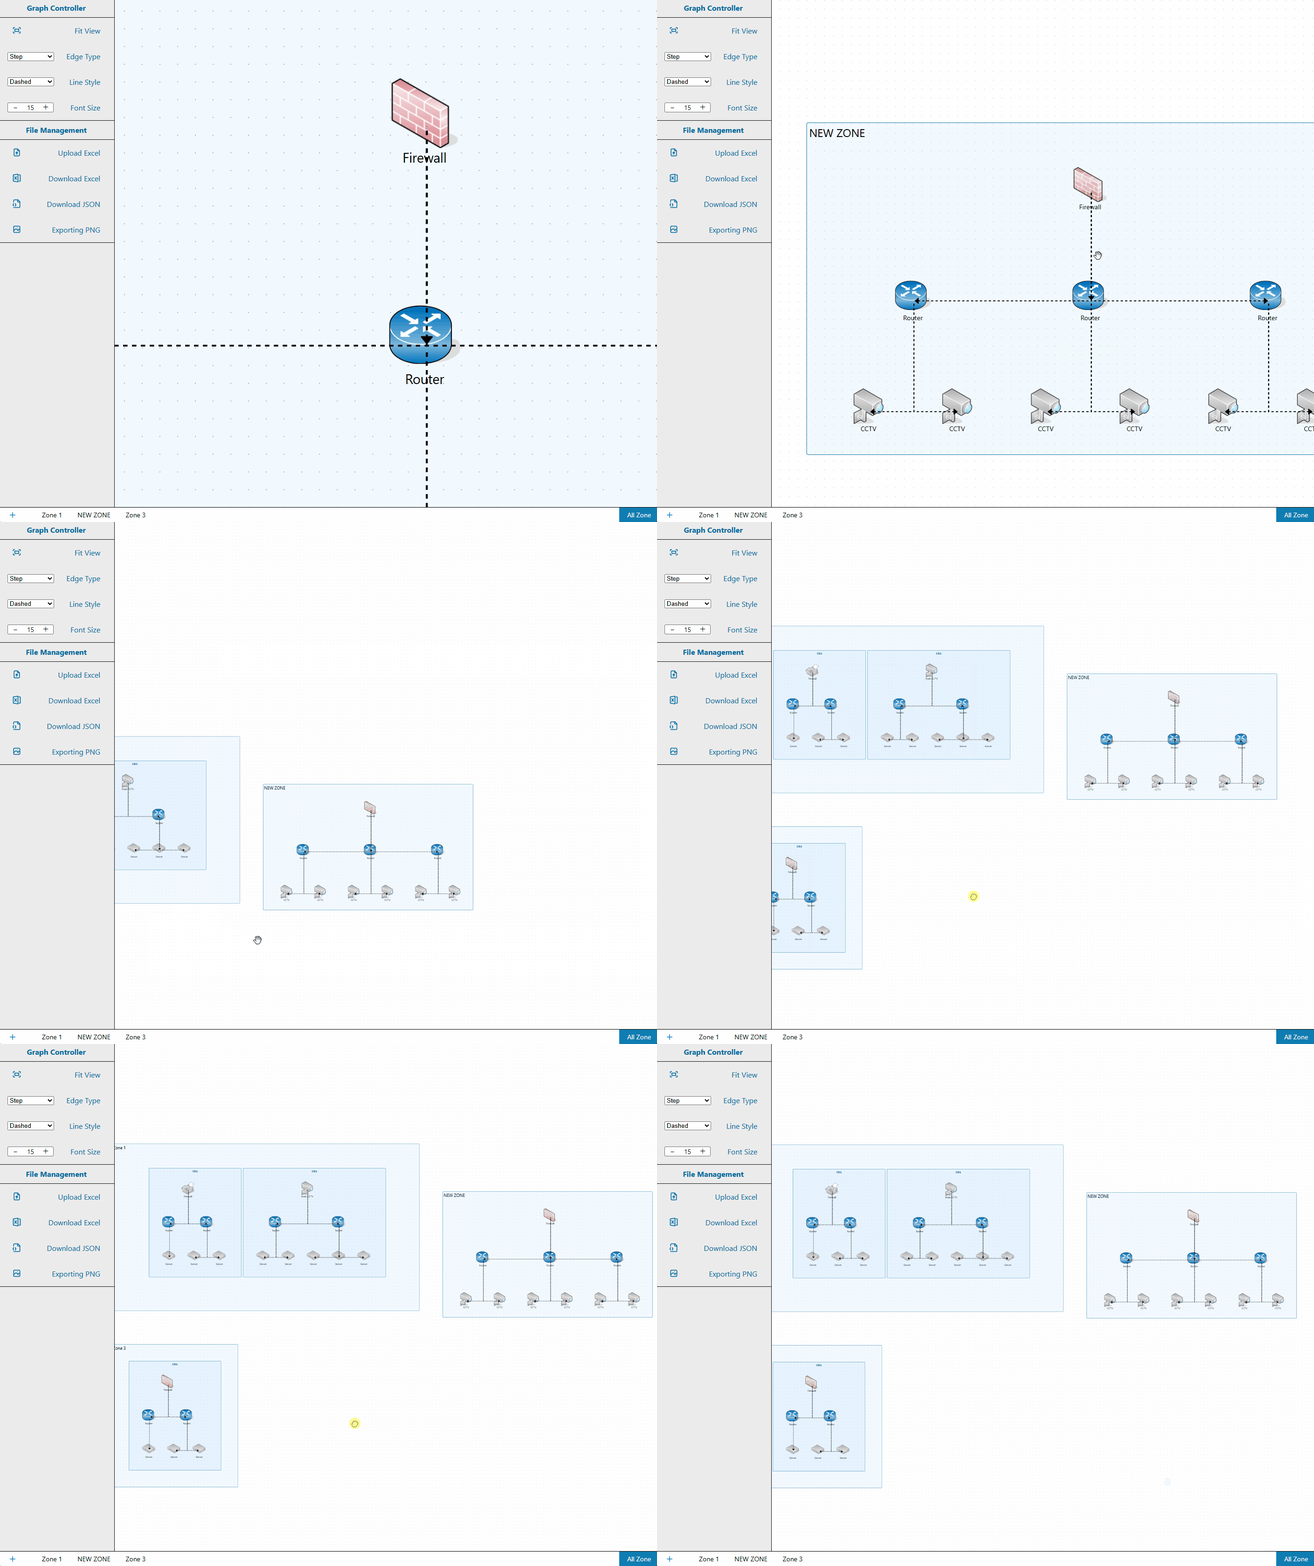
You can see all zones at once.
Convenient to see at a glance.
Zone View
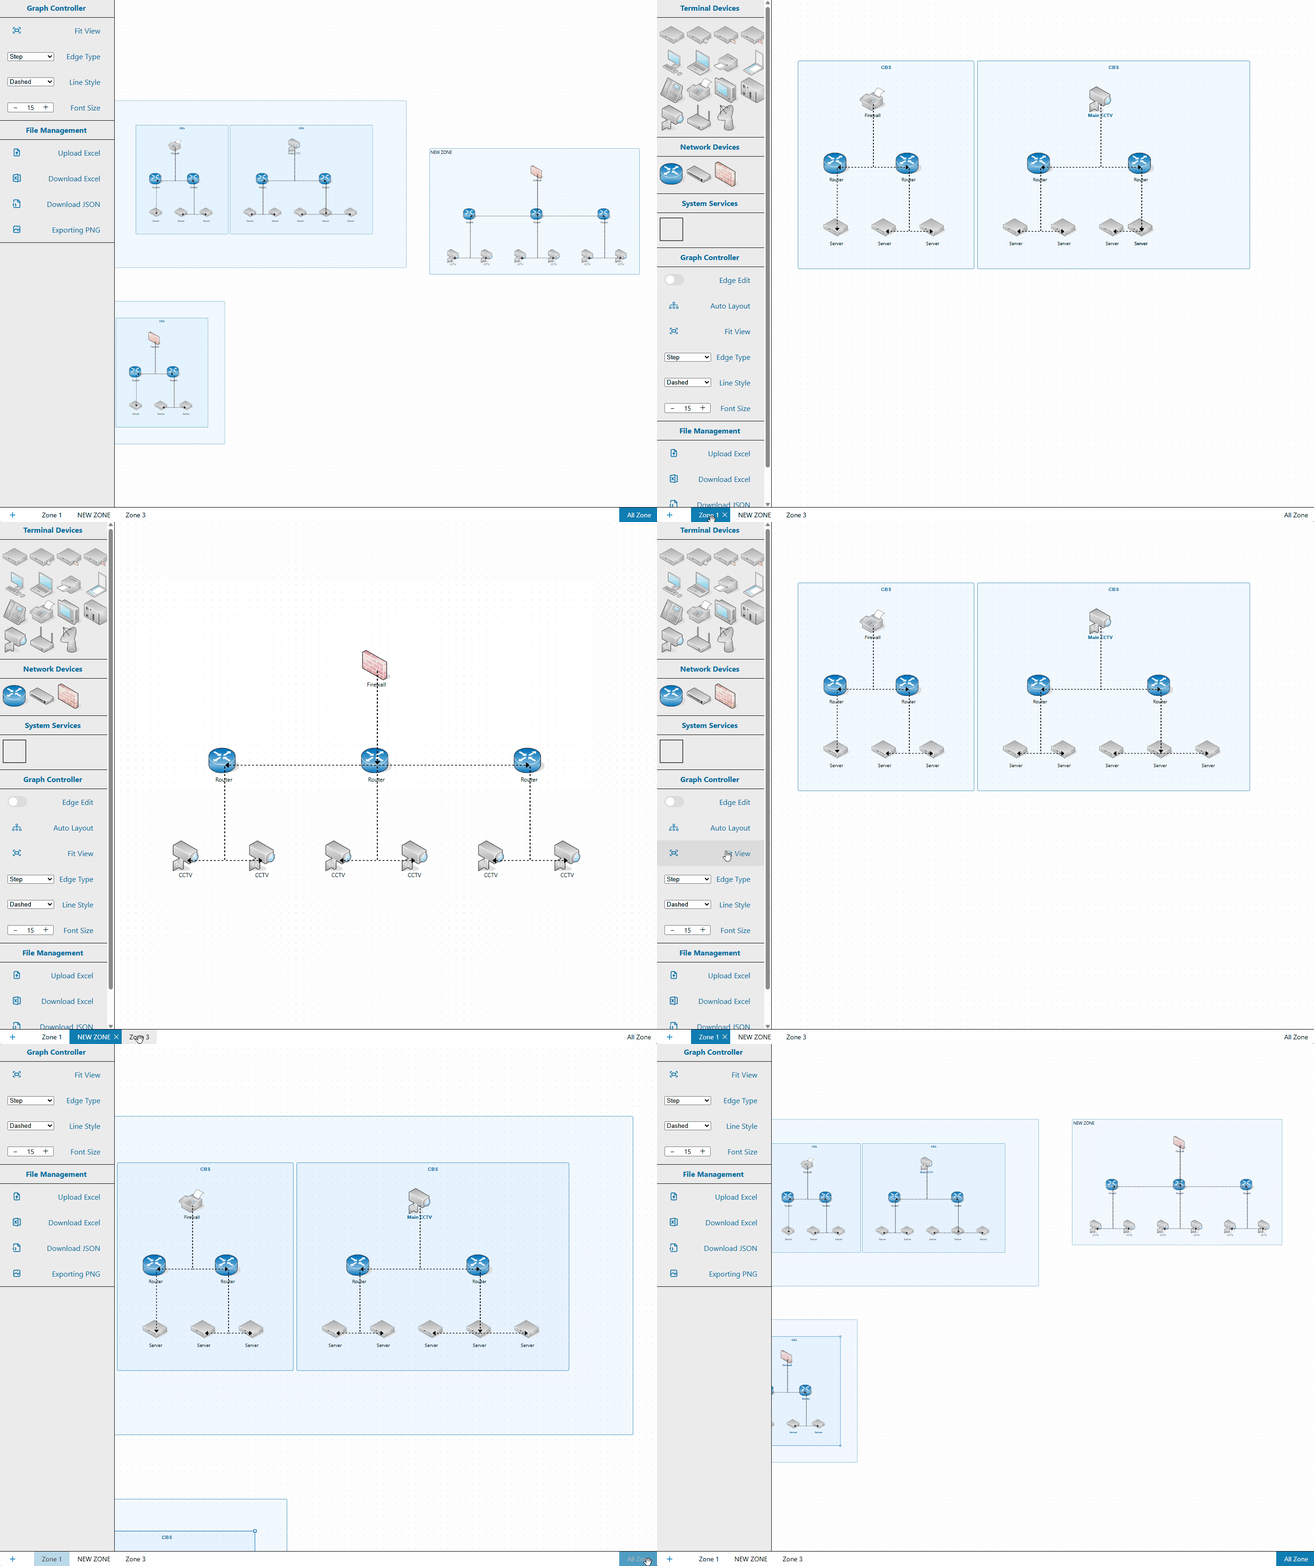
You can view each zone separately.
You can see the inside of each zone in detail.